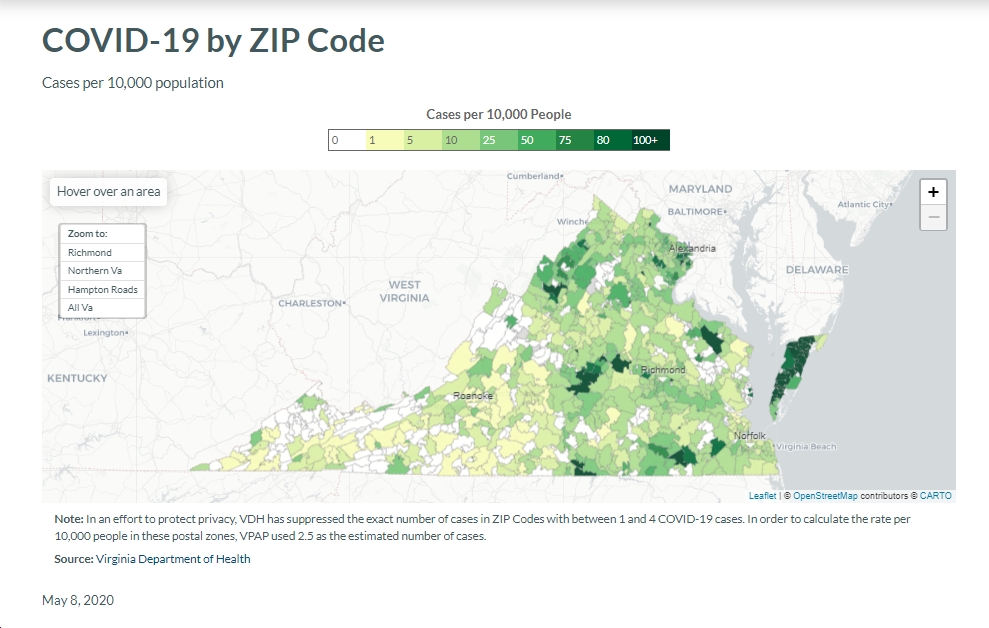
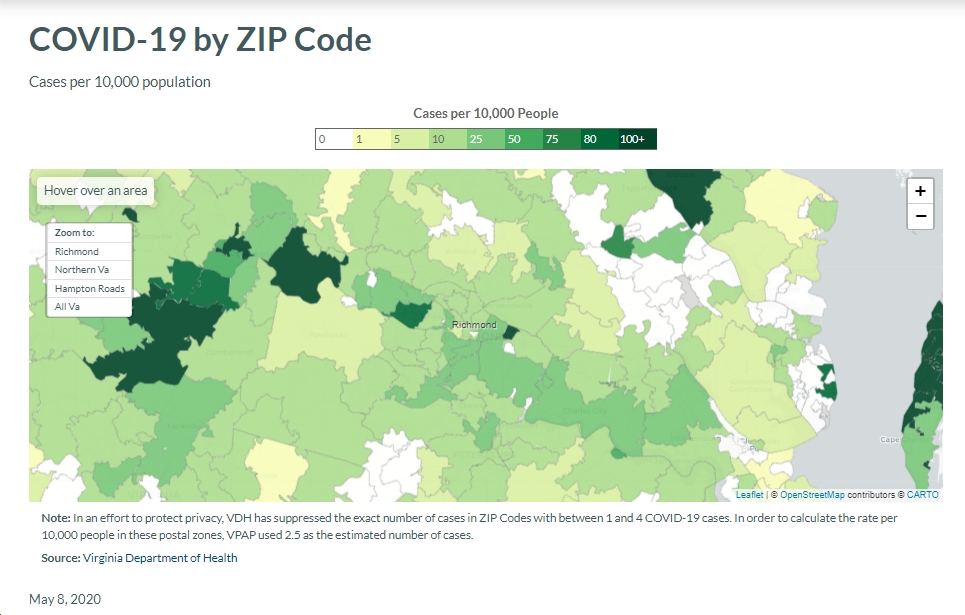
Yesterday, Sen. Scott A. Surovell (D-parts of Fairfax/Prince William/Stafford) posted the following, regarding data from the Virginia Department of Health showing COVID-19 cases by zip code, adjusted by VPAP by population, which I’d argue is crucial for these data to be looked at properly:
“Thank you VPAP…for taking a shot at showing Virginia COVID data on a per capita basis by zip code so we can now see the hotspots on a smaller level. Here you go. Worst zip in NOVA – West Alexandria. Worst in state – Nassawodox. Worst zips in VA are Rural – Accomack, Dillwyn, Capron, Warsaw. NOVA is bad in Alexandria, Falls Church, Manassas, Annandale and US 1 Corridor.”
Also see below for a few maps, including one of the entire state, as well ones focusing on Northern Virginia, Richmond and Hampton Roads areas. In addition to what Sen. Surovell posted, I’d add:
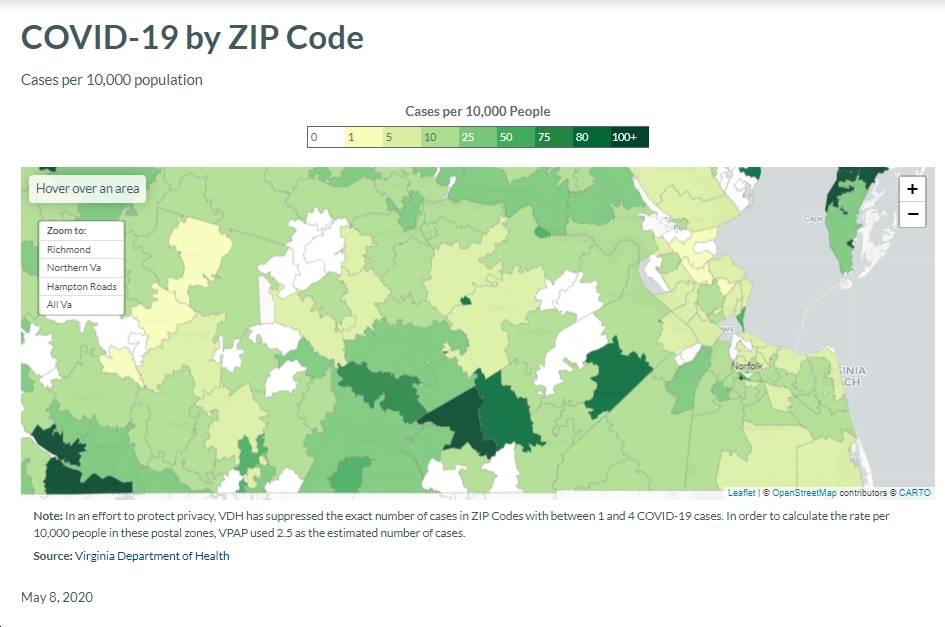
- In general, the Eastern Shore looks really on a per-capita basis for COVID-19 cases. For instance, as Sen. Surovell points out, Nassawodox is “worst in state,” at 654.8 cases per 10,000 population. Also, Onley on the Eastern Shore is at 301.3 cases per 10,000 population, Franktown at 289.9 cases per 10,000, Accomac at 218.5 cases per 10,000, etc. Not coincidentally, the Eastern Shore is home to a heavy concentration of poultry processing plants, which are hotbeds for COVID-19 spread.
- Dillwyn, home of the Dillwyn Correctional Center, is at 225.1 COVID-19 cases per 10,000 population.
- Capron, home of the Deerfield Correctional Center, is at 308.4 cases per 10,000 population.
- Fork Union, which has seen an outbreak at a long-term-care facility (“Envoy at The Village”), is at 393.4 cases per 10,000 population.
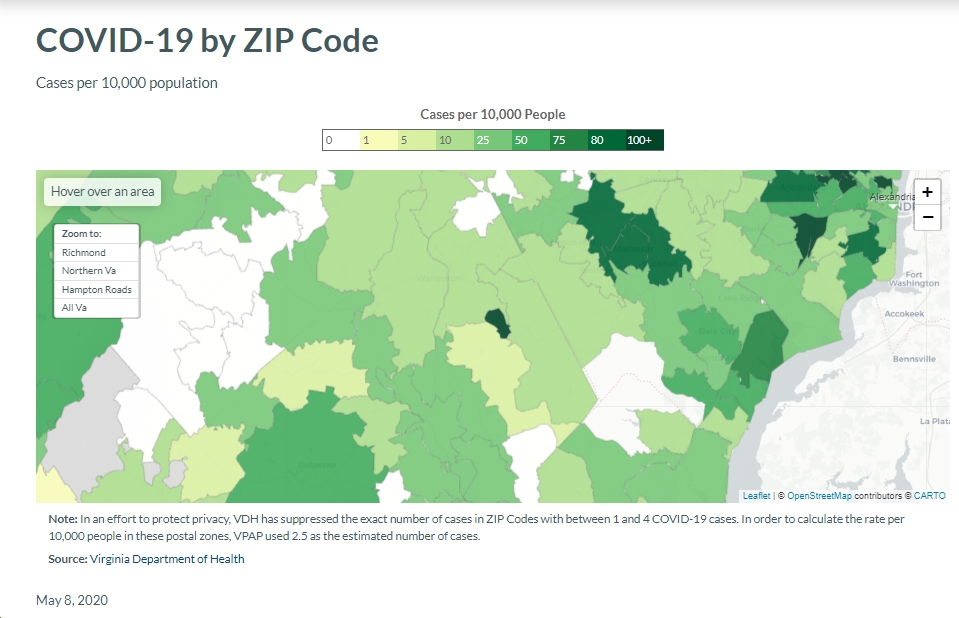
- Henrico 23075 is at 107.6 cases per 10,000 population, presumably related to the COVID-19 outbreak at the Canterbury Rehabilitation & Healthcare Center?
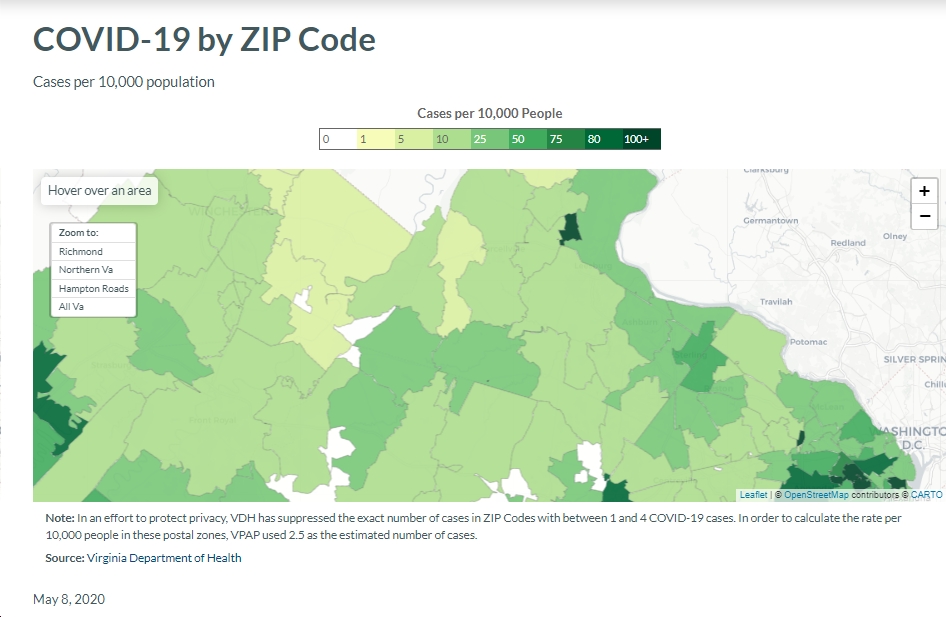
- In Northern Virginia, some hotspots are Alexandria 22305 (185.6 cases per 10,000), Dunn Loring 22027 (183.6 cases per 10,000), Springfield 22150 (134.2 cases per 10,000), Alexandria 22311 (105.5 cases per 10,000), Falls Church 22041 (110.1 cases per 10,000), Manassas 20109 (95.0 cases per 10,000), Manassas 20110 (83.5 cases per 10,000), Manassas 20111 (82.1 cases per 10,000), Woodbridge 22191 (78.4 cases per 10,000), Why are these areas so high? In part, it’s probably related to the fact that Springfield 22150 is home to the large Greenspring Senior Living Community; Alexandria 22311 is home to the Hermitage Northern Virginia Retirement Community and also Goodwin House AND also The Fountains at Washington House; Alexandria 22305…not sure exactly, but there are assisted living facilities in the area. So clearly, that’s part of the answer. But it’s almost certainly related to other – socioeconomic, etc. – factors as well; perhaps poorer communities where it’s more difficult to “socially distance,” where people work in retail, etc? Any other theories?

 Sign up for the Blue Virginia weekly newsletter


: “Spanberger is an outstanding candidate, and none of the prospective Republican candidates will be able to compete with her.”")
 announces candidacy for Lt. Governor")
